My Fearless Forecast.
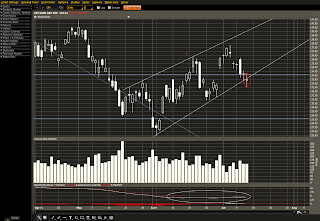
Above was the last chart I posted. Since then we have made it to the lower trend line of the small rising wedge depicted in dotted red.
In fact, today we managed to close below that trend support line as seen in the chart above. General thoughts are for a gap down in the morning then a fill and test of the bottom trend line which has now become trend resistance. The bull case would be a gap up into the wedge and another shot at the upper part of the wedge.
The above chart is my fearless forecast. The circles on the MACD are taken from OGM on the traders-talk->fearless forecast forum. You can find his original post here. Basically I am calling for a similar setup as last years jul/aug timeframe. The pink lines mark the path of the drop, while the green is the rebound. The target area is based on 1.62 * wave 1 (141.48-126.48) which is 24.3. The start of a wave 2 is at 137.8, so the target puts us around 113.5. That puts us in the first support band (the small rectangular area), which was support back at 11/10 and 11/11. Then a theoretical 38.2% retrace up, followed by another 15 SPY points down to somewhere in the 110-107 area. The rebound in green would ultimately trace out the right shoulder of a head and shoulders pattern.


2 comments:
It’s nearly impossible to find educated people for this subject, however, you seem like you know what you’re talking about! Thanks
- taxi booking in ahmedabad | book a cab in ahmedabad | car rental services in ahmedabad
Thanks Guy.
Everyone keeps saying this market is about to crash, what a load of crap.
Have a look at this guy from the US, his calls on the market have been killer and rediculously accurate ==> http://www.bit.ly/1fMcakI
He is saying we are about to ROCKET higher on the stock market!
24 hours later, we are up. This market is not dying yet. No way. NASDAQ is at 15 year highs! WOW.
Post a Comment